Publication of SNO ICOS-France-Atmosphere CO2 and CH4 measurements
Written by Michel Ramonet, Morgan Lopez
Climate and Environmental Sciences Laboratory (LSCE, CNRS/CEA/UVSQ)
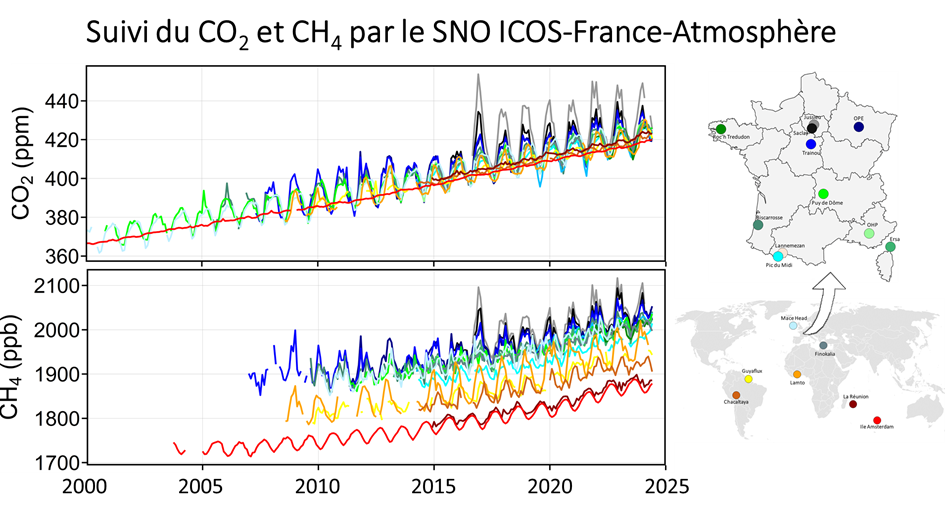
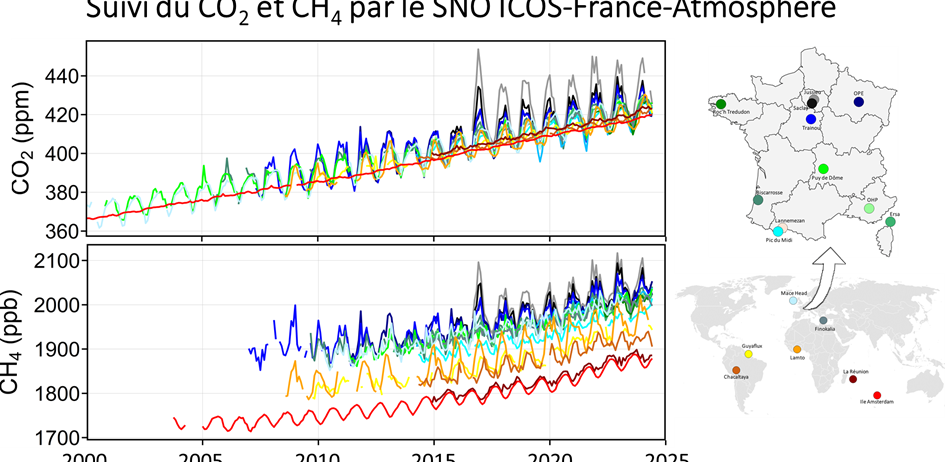
Long-term greenhouse gas (GHG) observation programs are essential to our understanding of the increasing concentration of these gases in our atmosphere in response to human activities, and to the climatic perturbations affecting the natural fluxes of CO2 and CH4. The Service National d’Observation ICOS-France-Atmosphère (SIFA) represents one of the most important GHG measurement networks in Europe, and as such makes an essential contribution to the determination of GHG balances on the European continent. It represents the French contribution to the atmospheric observation network of the European research infrastructure ICOS-ERIC. The SIFA network comprises 18 measuring stations, including 11 in mainland France (Figure 1). Following standardized protocols, we continuously measure CO2, CH4 and CO concentrations, as well as meteorological parameters (wind speed and direction, temperature, pressure and relative humidity) at all these stations. At 6 stations, we are also measuring N2O concentrations, which will be made available on the AERIS atmospheric data and services center (aeris-data.fr) when the data are published. An update of CO2 and CH4 measurements up to the end of March 2024 has been published on AERIS. These measurements, shown in Figure 1, demonstrate the uninterrupted annual increase in CO2 and CH4 concentrations in response to the continuing growth in global fossil fuel consumption. Long-term trends are superimposed by seasonal cycles and interannual variations, largely linked to the variability of CO2 and CH4 exchanges with natural reservoirs (e.g. forests, soils, wetlands, oceans, etc.) through processes that we are seeking to better understand.
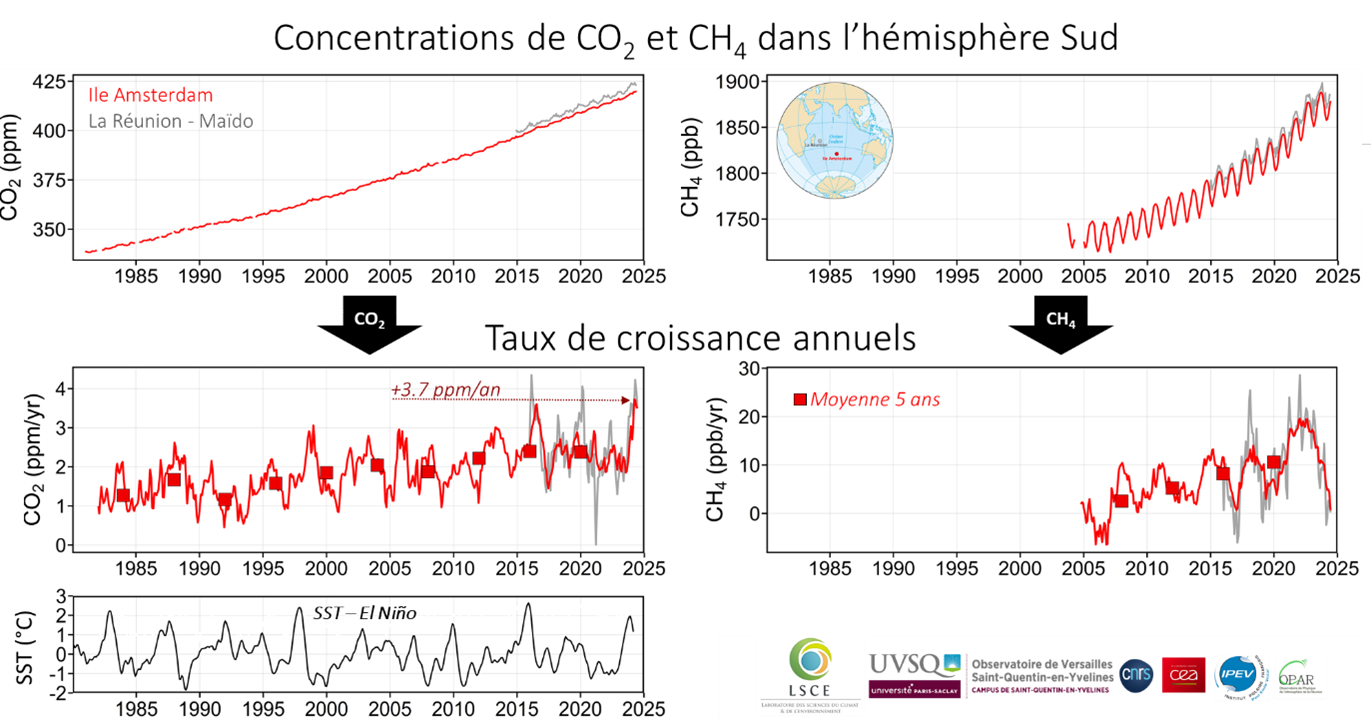
The concentration of CO2 on Amsterdam Island reached a new high of 420 ppm (parts per million), 24% above the level first measured on the island in 1980 (Figure 2). The annual growth rate has also reached an all-time high, with an increase of +3.7 ppm between April 2023 and April 2024, reflecting the increasing rate of CO2 growth in the atmosphere. The previous highest value for the CO2 growth rate was observed between July 2015 and July 2016 (+3.6 ppm). What these two growth maxima have in common is that they follow El Niño episodes, a climatic phenomenon that causes global temperatures to rise and fuels numerous extreme events around the world. These climatic disturbances affect CO2 exchanges with the oceans and terrestrial ecosystems (droughts, fires, etc.), and result in a temporary acceleration in CO2 growth. Excess CO2 associated with El Nino events is superimposed on man-made emissions, which are responsible for the rise in CO2 concentrations observed everywhere, including in very remote observatories such as Amsterdam Island and Reunion Island (Figure 2).
Methane concentrations measured since 2004 on Amsterdam Island have also been rising, and now exceed 1850 ppb (parts per trillion). As with CO2, the rate of CH4 growth shows variations from one year to the next, superimposed on a long-term upward trend. In contrast to CO2, recent months have seen moderate growth in methane (below 5 ppb/year), whereas it had reached record rates, in excess of 15 ppb/year, between 2020 and 2022. The acceleration in CH4 growth in recent years appears to be attributable to several causes, including significant emissions from tropical wetlands, and an increase in methane lifetime linked to the drop in nitrogen oxide emissions during the 2020 confinements.